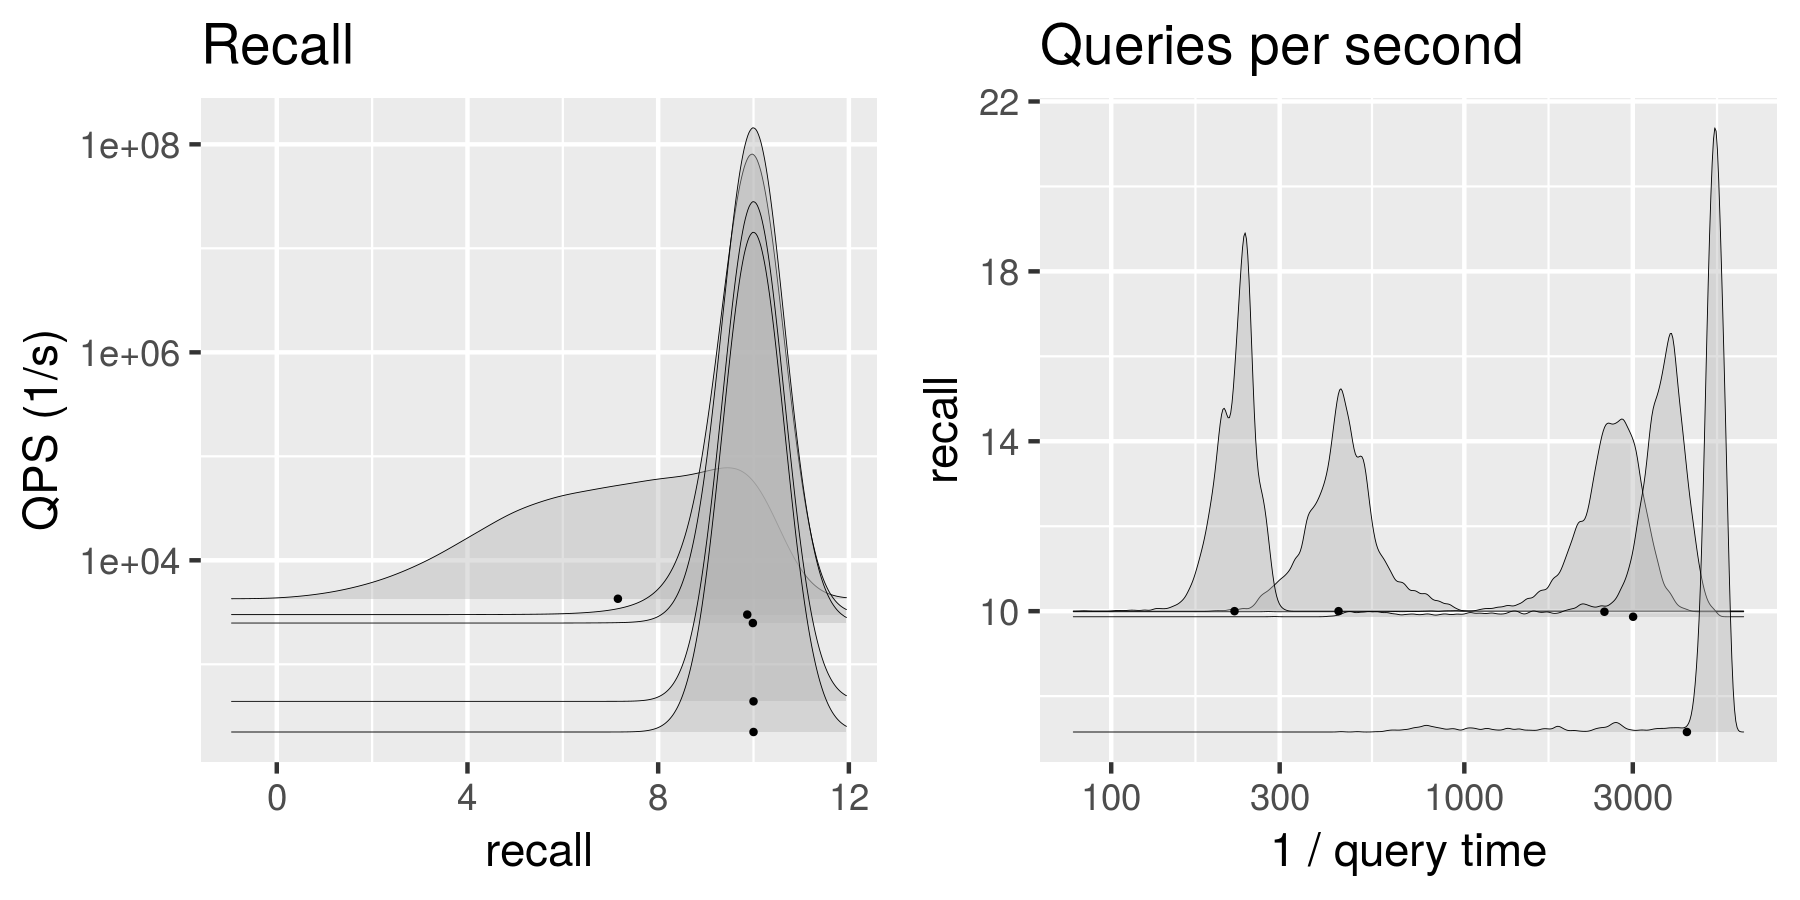
Distributional Plot Recall vs LID
The following plot shows the Recall vs LID trade-off as distributional plots over all queries. Intensity of the square represents how many of the queries fall into this region of LID/recall valeus. Change the algorithm/dataset/difficult using the buttons below the plots.
Algorithm
Dataset
Difficulty
Contact
ANN-Benchmarks has been developed by Martin Aumueller ([email protected]), Erik Bernhardsson ([email protected]), and Alec Faitfull ([email protected]). Please use Github to submit your implementation or improvements.