Distributional plots Recall vs. Query Time
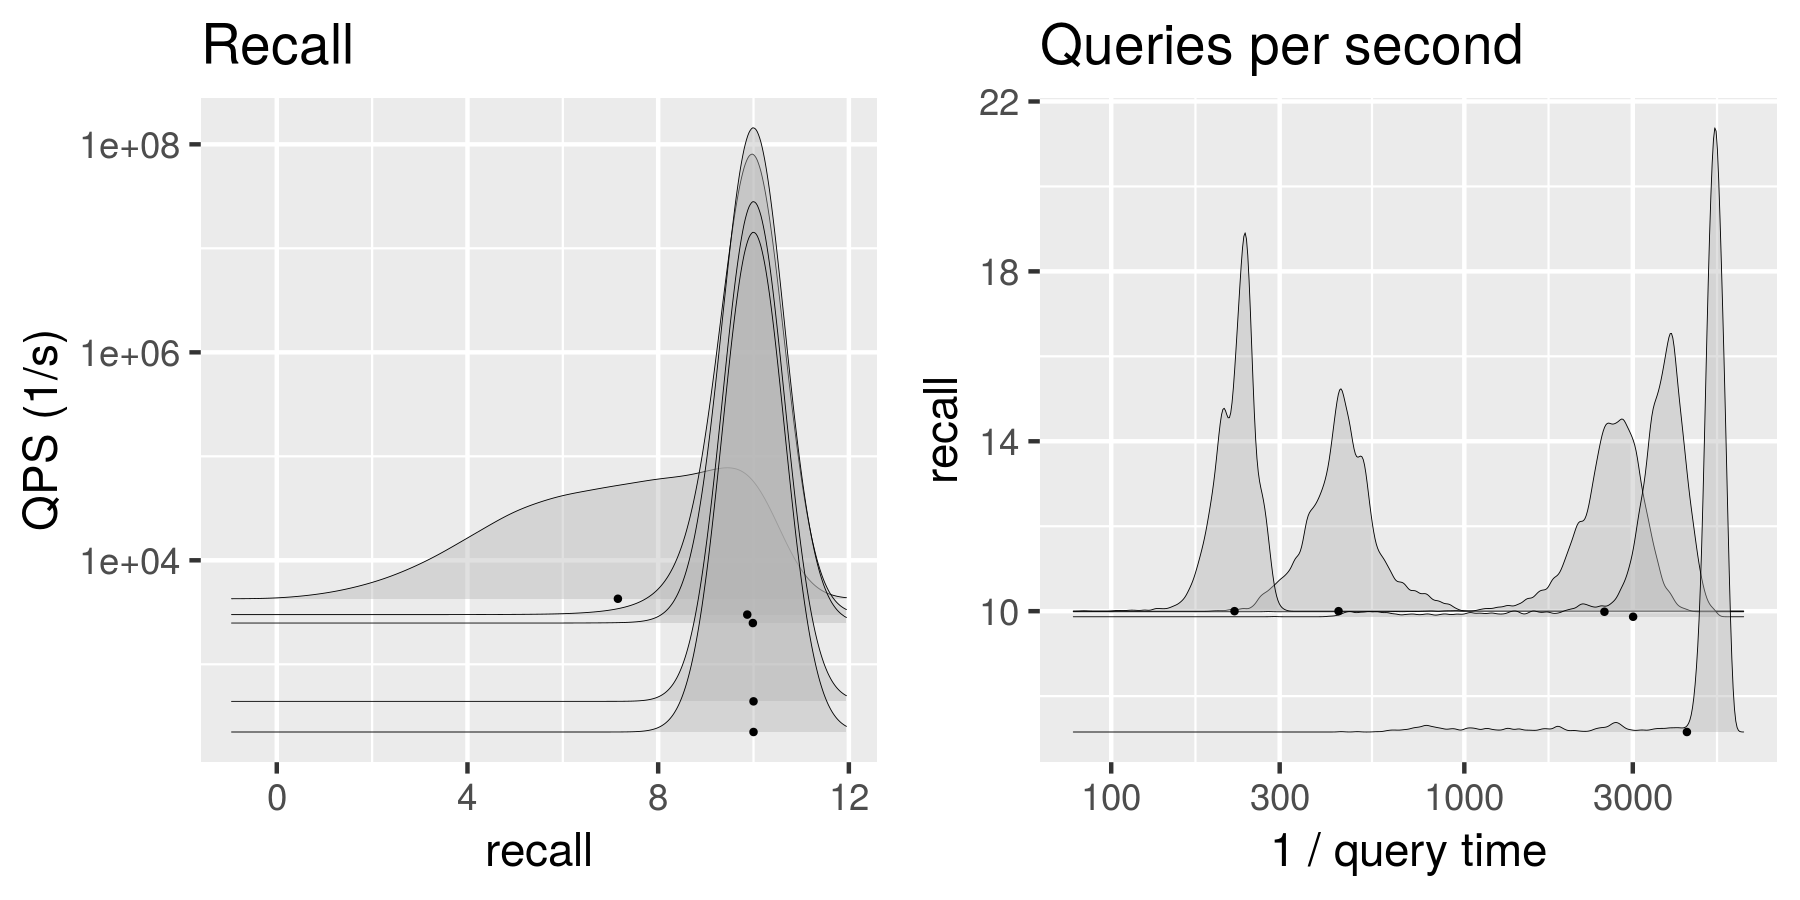
The following plots show the QPS vs. Recall trade-off as distributional plots over all queries. The plot on the left shows the recall achived (dots mark the average recall), the plot on the right depicts the query time in relation to the recall achieved (dots mark the average query time). Change the algorithm/dataset/difficult using the buttons below the plots.
Algorithm
Dataset
Difficulty
Parameter
Contact
ANN-Benchmarks has been developed by Martin Aumueller ([email protected]), Erik Bernhardsson ([email protected]), and Alec Faitfull ([email protected]). Please use Github to submit your implementation or improvements.